Introduction
Choosing between rooftop and utility-scale solar EPC work is the single most consequential decision for many EPC firms in India. Revenue headlines lure you toward large MW contracts, but profitability depends on cash flow, risk, and execution capability. This guide compares both models with practical examples, real risks, and tactical advice so you can decide where to focus resources.
Quick summary – the bottom line
- Rooftop projects usually deliver higher margins and faster cash recovery.
- Utility-scale projects bring scale and brand visibility but compress margins and increase working capital needs.
- Most mid-sized EPCs are more profitable focusing on rooftop work unless they have strong finance, execution, and risk controls.
What defines each project type?
Rooftop EPC
- Small to medium systems (kW to low MW).
- Installed on commercial, industrial, or residential roofs.
- Faster execution and billing.
Utility-scale EPC
- Ground-mounted plants (multi-MW to hundreds of MW).
- Large civil works, grid evacuation, and staggered milestones.
- Longer timelines and heavy guarantees.
Where profit comes from – a breakdown
Key profit drivers
- Equipment cost per kW (lower in utility due to bulk buying)
- Execution cost (higher for utility due to heavy civil work)
- Working capital & payment terms (tighter for utility)
- Risk of LDs, delays, and compliance (higher for utility)
Typical margin bands (industry averages)
| Project Type | Typical EPC Margin (after direct costs) |
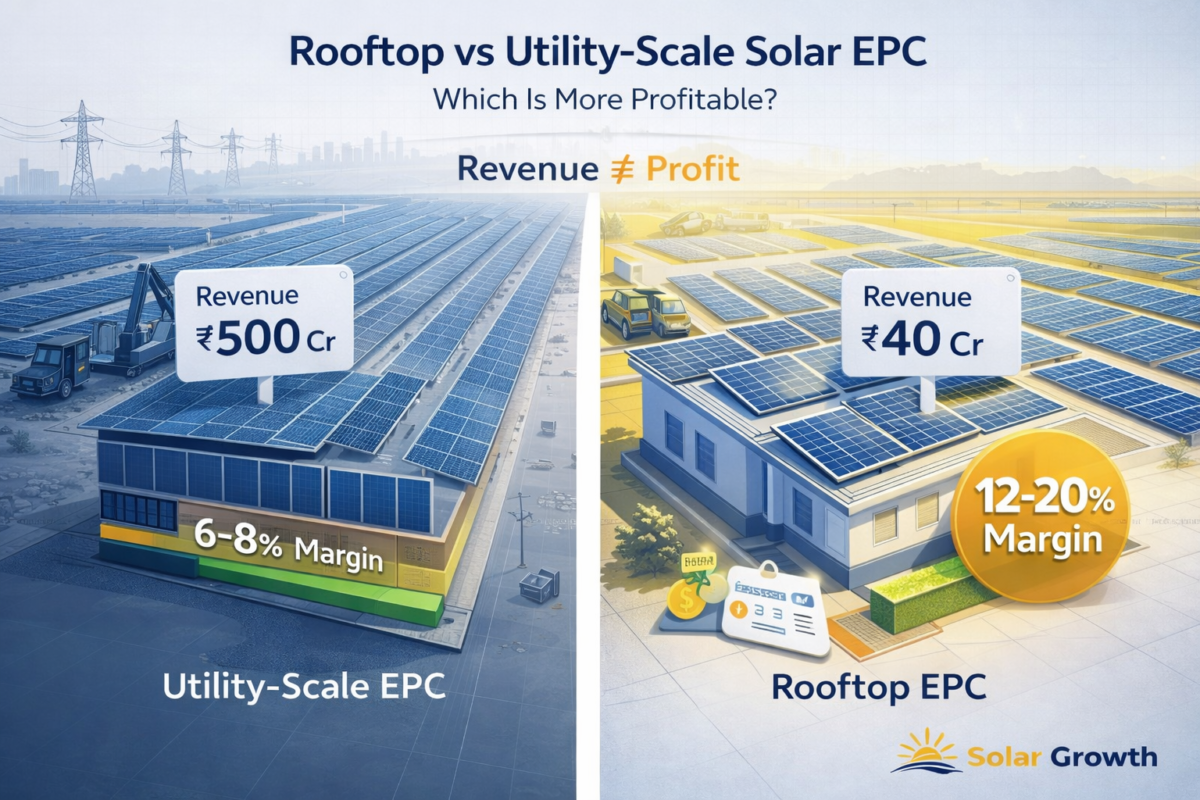
| Rooftop (C&I) | 12%–20% |
| Utility-scale | 6%–10% |
These are ranges, not guarantees. Your marginal outcome depends on project selection and financial discipline.
Cash flow: where rooftop wins hands down
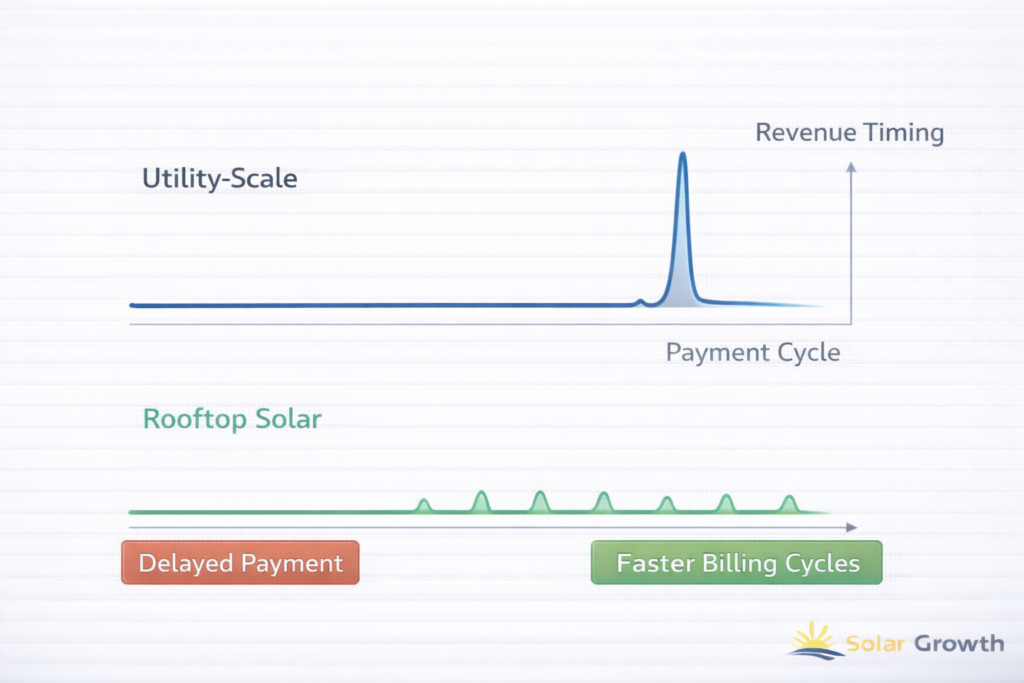
Rooftop projects usually allow faster invoicing and partial advance payments. That reduces working capital requirements and speeds turnover.
Example: A 500 kW rooftop project completed in 6–8 weeks can yield final payments in 2–3 months. A 50 MW utility plant might take 8–12 months before key milestones release large payments and retainers and PBGs hold significant sums back.
Consequence: If you can’t finance long cash cycles, utility projects will kill margins through financing costs alone.
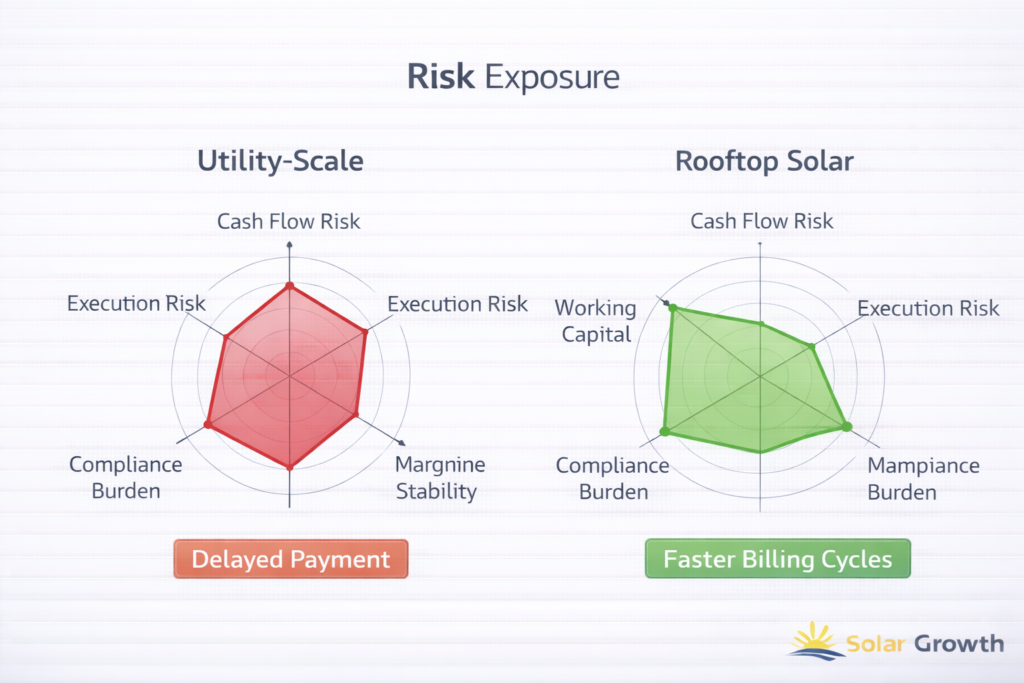
Risks: higher and hidden in utility projects
Rooftop typical risks
- Roof structural issues
- Client coordination & access
- Variability of small components
These are local and manageable with good pre-site surveys.
Utility-scale typical risks
- Land title and ROW delays
- Grid evacuation & substation readiness
- Soil and excavation surprises
- Weather delays across seasons
- Tender clause traps (strict LDs, PBGs)
Real scenario: An EPC contractor underpriced a 30 MW project. Unexpected rock and drainage work added 6% to civil costs and pushed the schedule 4 months. That single issue erased margins.
Cost structure differences (practical view)
| Cost Head | Rooftop | Utility-Scale |
| Modules per kW | Higher | Lower |
| Mounting & civil | Lower | Higher |
| Logistics | Low | High |
| Labour scale | Small teams | Large crews & machinery |
| Permits & documentation | Minimal | Heavy |
| O&M (long term) | Varies | Often bundled |
Pricing approach that works for each
Rooftop pricing best practices
- Componentized BOQ (modules, inverters, civil, installation)
- Fixed margins by client category (residential vs C&I)
Example: Price rooftop projects using a 5–10% working buffer and insist on 20–30% advance to secure cashflow.
Utility pricing best practices
- Risk allocation & contingency (5–8% for civil/geotech uncertainty)
- Cashflow modelling with interest cost built in
- Contract negotiation on PBGs and LDs — seek staged reductions
Example: For utility tenders, price in a finance cost line item (loan/discount cost) and a performance buffer. Don’t compete purely on price show execution strength and risk mitigation.
Operational reality: capability and scale
When rooftop is smarter
- You have a nimble sales team that converts many small projects.
- You want predictable cash flow and quick ROI.
- You’re building a repeatable operations playbook.
When utility makes sense
- You have strong balance sheet or credit lines.
- You can mobilize heavy equipment and manage complex civil works.
- You want brand recognition and long-term alliances with IPPs/DISCOMs.
Tip: Many profitable firms run a hybrid model: rooftop for steady cash, utility selectively to build profile and relationships.
Common mistakes EPCs make (and how to fix them)
- Chasing MW, ignoring margin
- Fix: Use project IRR and cashflow impact, not just revenue.
- Underpricing risk in utility tenders
- Fix: Add specific contingency lines for soil, grid, and weather.
- Ignoring payment terms
- Fix: Simulate worst-case payment delays and price finance costs.
- Treating all projects the same
- Fix: Create pricing templates by project type and client category.
Checklist before you bid (quick practical list
- Site survey and geotech complete.
- Clear BOQ and supplier quotes locked where possible.
- Cashflow plan showing loan costs and retentions.
- Compliance & tender documents ready in correct format.
- Contingency and LD exposure quantified.
Benchmarks & standards to watch (India specific)
- MNRE procurement guidelines for tenders (follow current updates).
- IEC standards for modules and inverters (IEC 61215, IEC 61730, etc.)
- DISCOM/SECI tender templates — read evaluation criteria carefully.
- Typical payment cycles: rooftop often T+30–90; utility often milestone-based with 5–10% retention.
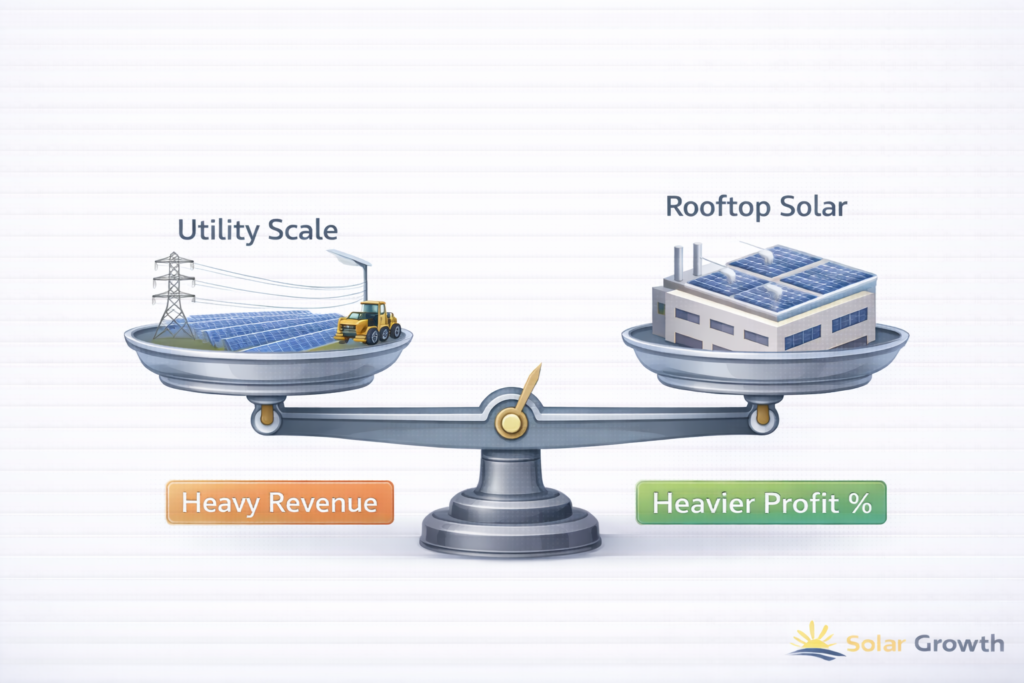
Conclusion – choose profit, not prestige
Rooftop EPCs generally give healthier margins and faster cash flows for most mid-sized EPCs in India. Utility projects bring scale but demand financial strength and strict risk pricing. The smartest firms balance both: use rooftop to sustain margins and cash while taking selective utility bids to build credibility.
If you aim to scale profitably, prioritize cashflow modelling, contract risk allocation, and standardised pricing templates. Never bid utility scale without a disciplined contingency and financing plan.
Written by Rohith
Solar Industry Analyst at Solar Growth, covering India’s solar value chain, policy landscape, and business growth trends